Unified Local Observability for AI Coding Assistants
Track costs, debug traces, and monitor all your AI tools in one privacy-first dashboard. Your data stays on your machine.
Works with your favorite AI tools
Everything You Need
Powerful features to understand and optimize your AI tool usage
Multi-Tool Support
Works with Claude Code, Gemini CLI, and OpenAI Codex CLI. Monitor all your AI coding assistants from one unified dashboard.
Real-Time Dashboard
Live WebSocket updates as telemetry arrives. Customizable drag-and-drop widgets with multiple visualization types.
Cost Tracking
Embedded pricing data for 67+ models across Claude, Codex, and Gemini. Understand exactly what you're spending.
Historical Import
Import past sessions from local JSONL/JSON files with automatic cost calculation. Analyze your complete AI tool history.
DuckDB Analytics
Powered by DuckDB for instant queries on large datasets. Fast aggregations, filtering, and time-series analysis.
Privacy First
All data stays on your machine. Self-hosted with zero external dependencies—complete control over your telemetry.
Single Binary
One ~54MB executable with embedded frontend. No external dependencies, no configuration—just run and go.
OTLP Native
Standard OpenTelemetry Protocol ingestion via HTTP/JSON and HTTP/Protobuf. Works with any OTLP-compatible tool.
Data Export
Export telemetry to portable Parquet files with optional DuckDB views database. Archive, share, or analyze externally.
How It Works
Get up and running in minutes with three simple steps
Start AI Observer
Run AI Observer locally via Docker, Homebrew, or binary. It starts a local server that listens for telemetry data.
Configure Your AI Tools
Point your AI coding assistants to send OpenTelemetry data to AI Observer. Simple environment variable configuration.
Monitor & Analyze
Open the dashboard to see real-time metrics, traces, and logs. Track costs, debug issues, and optimize usage.
Quick Start
Get AI Observer running in under a minute
# Pull and run AI Observer
docker run -d \
  --name ai-observer \
  -p 4318:4318 \
  -p 8080:8080 \
  -v ai-observer-data:/data \
  tobilg/ai-observer:latest

# Dashboard: http://localhost:8080
# OTLP endpoint: http://localhost:4318
Configure Your AI Tools
Point your AI coding assistant to send telemetry to AI Observer:
# Add to ~/.bashrc or ~/.zshrc
export CLAUDE_CODE_ENABLE_TELEMETRY=1
export OTEL_METRICS_EXPORTER=otlp
export OTEL_LOGS_EXPORTER=otlp
export OTEL_EXPORTER_OTLP_PROTOCOL=http/protobuf
export OTEL_EXPORTER_OTLP_ENDPOINT=http://localhost:4318
export OTEL_METRIC_EXPORT_INTERVAL=10000
export OTEL_LOGS_EXPORT_INTERVAL=5000
export OTEL_LOG_USER_PROMPTS=1
See It in Action
A beautiful, powerful dashboard for all your AI observability needs
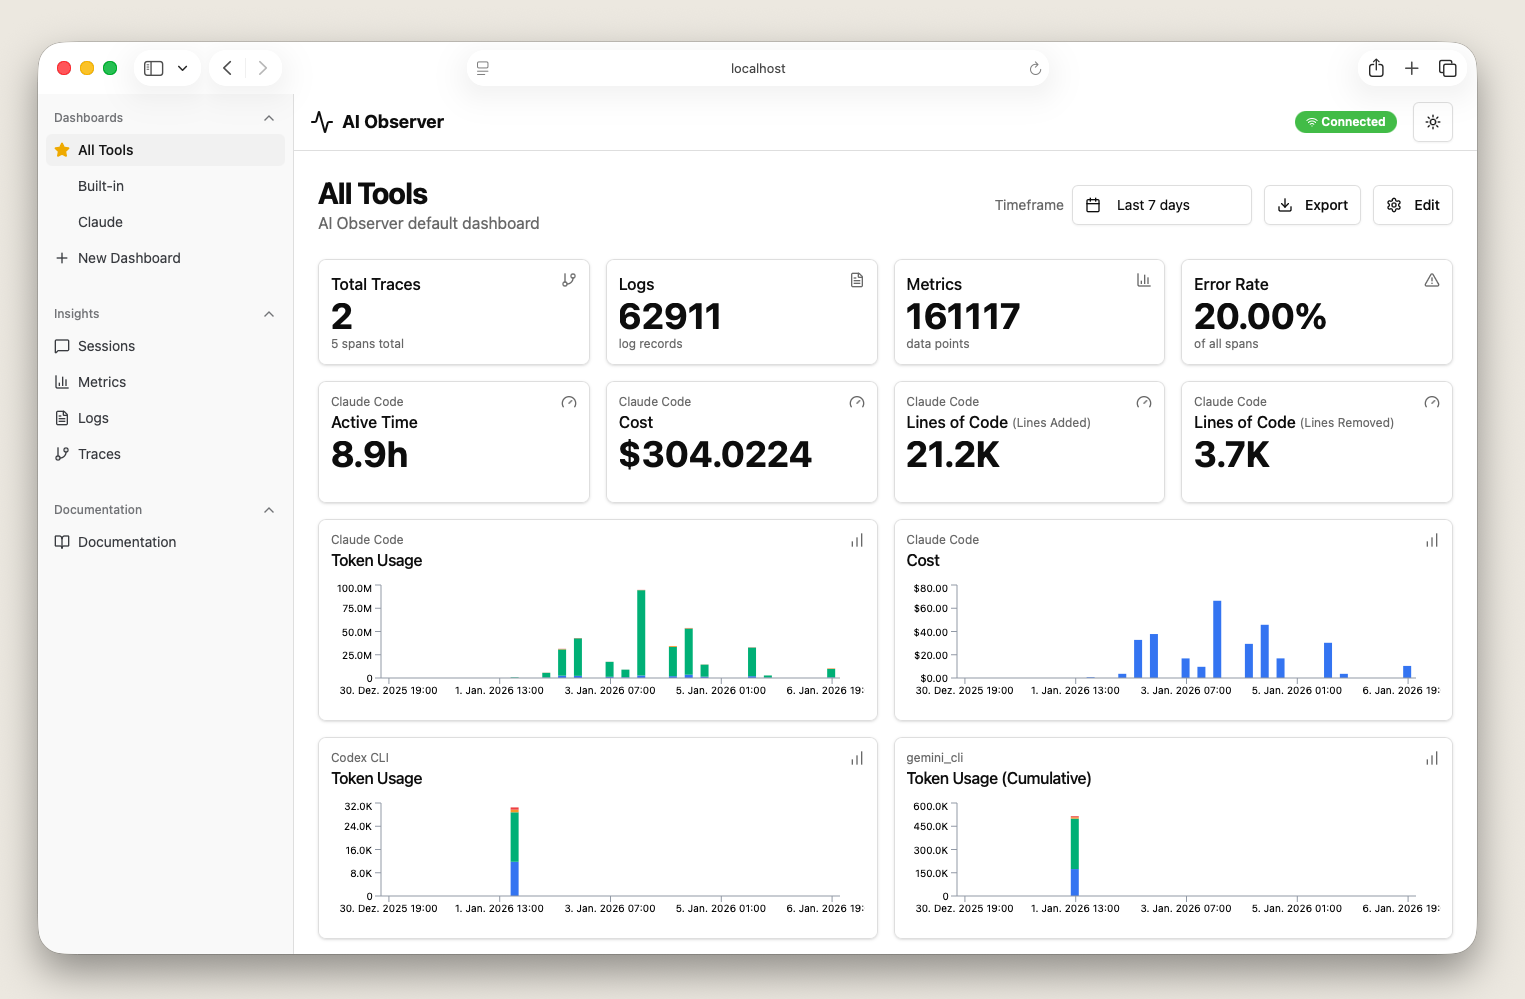
Dashboard Overview
Real-time metrics and KPIs at a glance
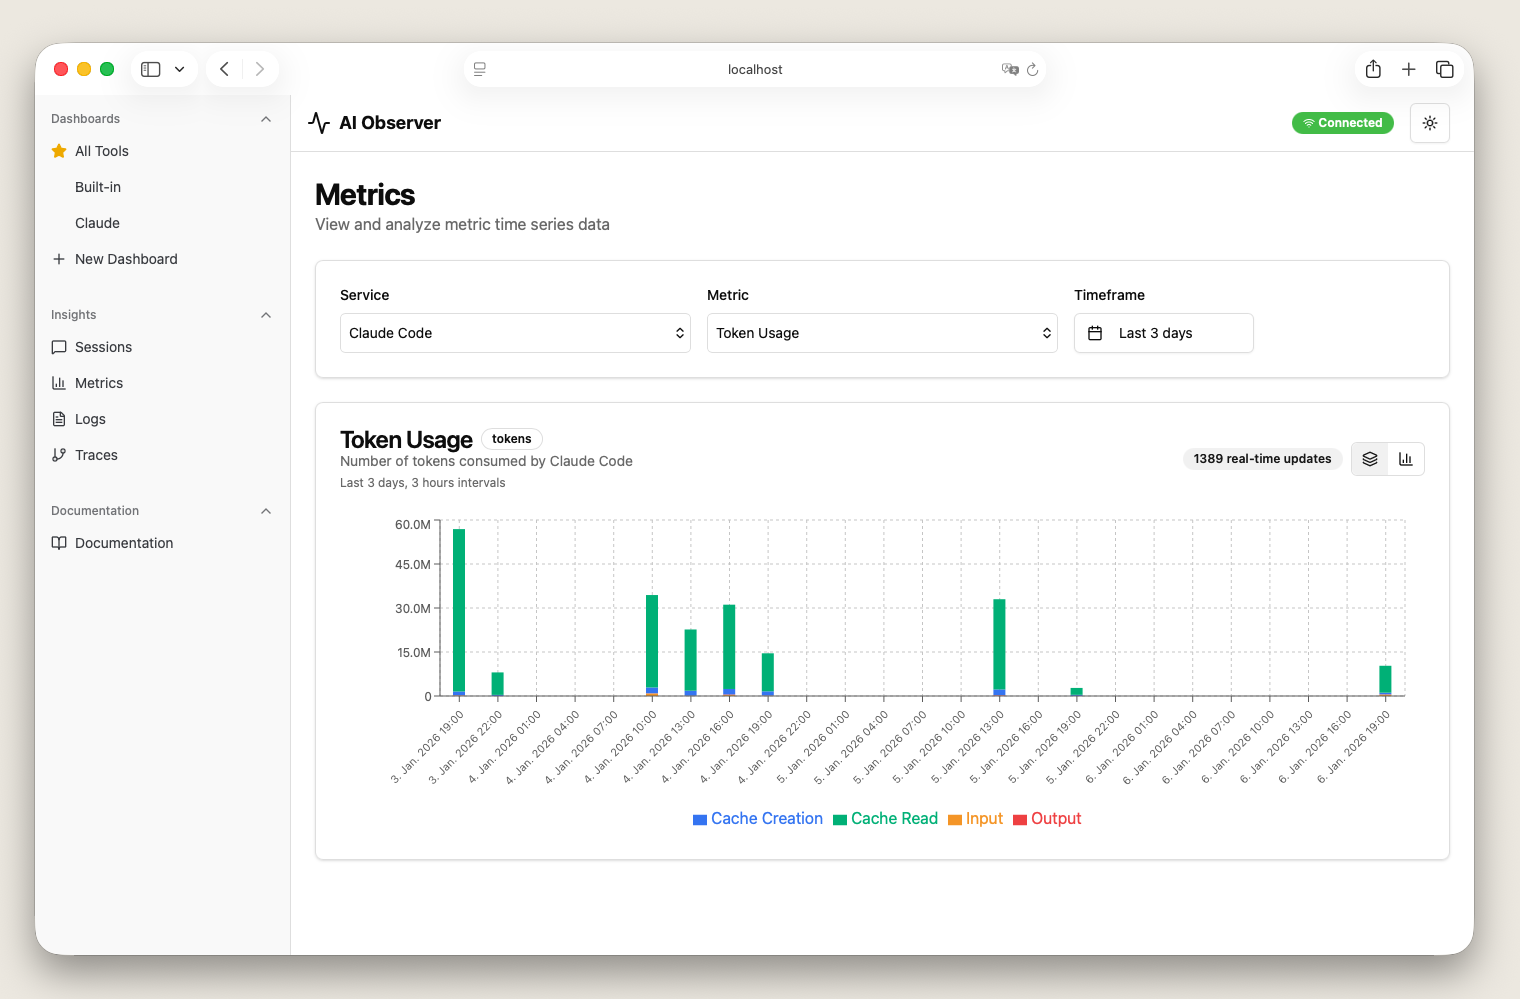
Cost Analytics
Track spending across all AI models
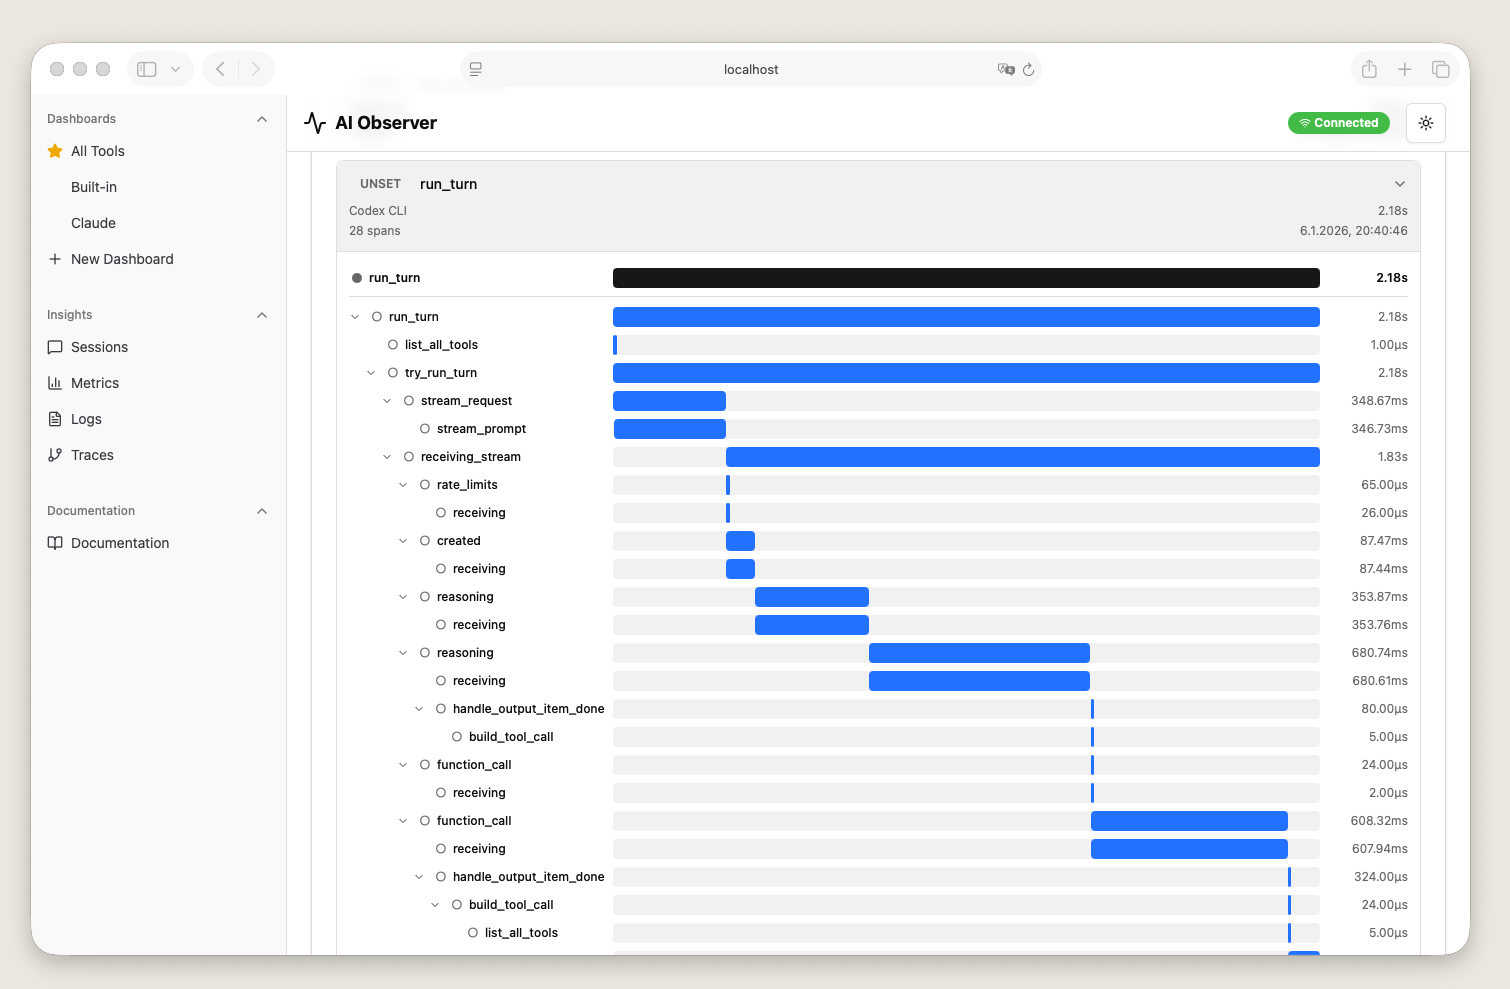
Trace Explorer
Debug and analyze AI tool interactions
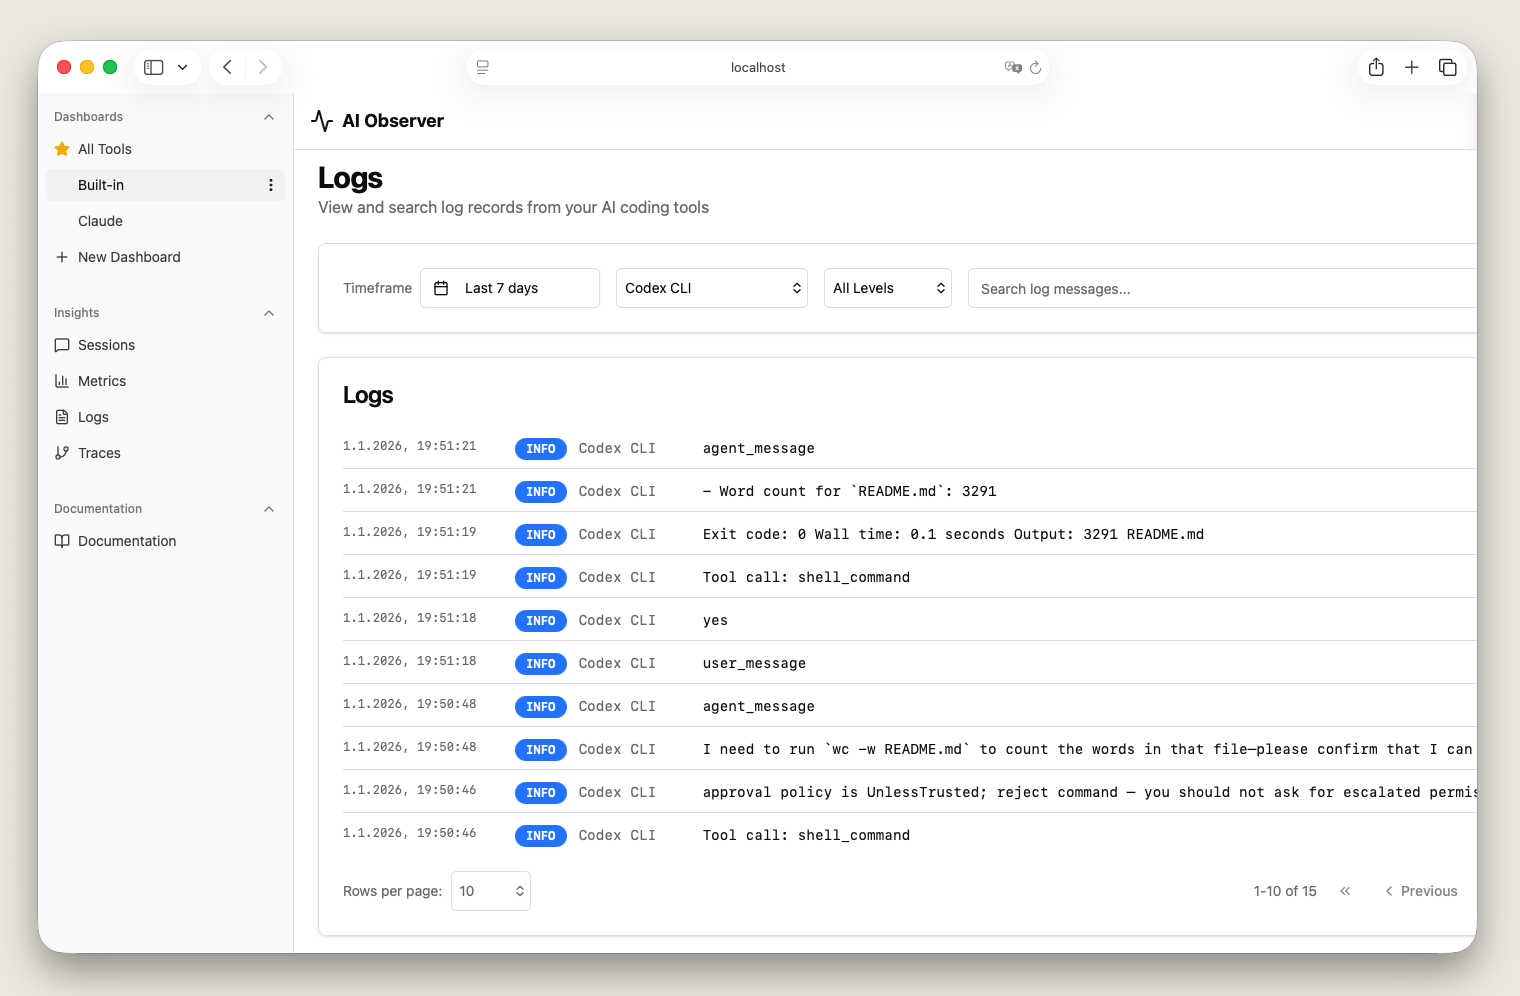
Logs Viewer
Search and filter telemetry logs
Free & Open Source
No subscriptions, no limits, no strings attached
Join the community
Star on GitHub